|
<< Click to Display Table of Contents > Dynamic Ramping |
  
|
|
<< Click to Display Table of Contents > Dynamic Ramping |
|
This dialog behaves identically for both power and speed ramping. Using the respective Settings buttons, the user can open either the speed ramping map or the power ramping map.
The following example shows the speed ramping dialog. For power ramping, the same logic applies; wherever speed is referenced, it is replaced by power.
The y-axis represents the speed/power factor in percent, relative to the defined mark speed of the same pen.
The x-axis represents the vector length.
Modifications can either be done via the graph or by editing the table.
Only percentage values between 0 and 100 are allowed for both vector length and speed/power factor.
Each individual vector is then processed using the defined power and speed mapping.
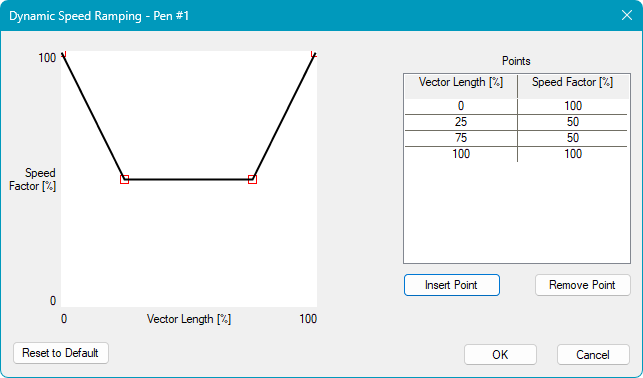
Figure 137: Dynamic Speed Ramping