|
<< Click to Display Table of Contents > Timing Diagram |
  
|
|
<< Click to Display Table of Contents > Timing Diagram |
|
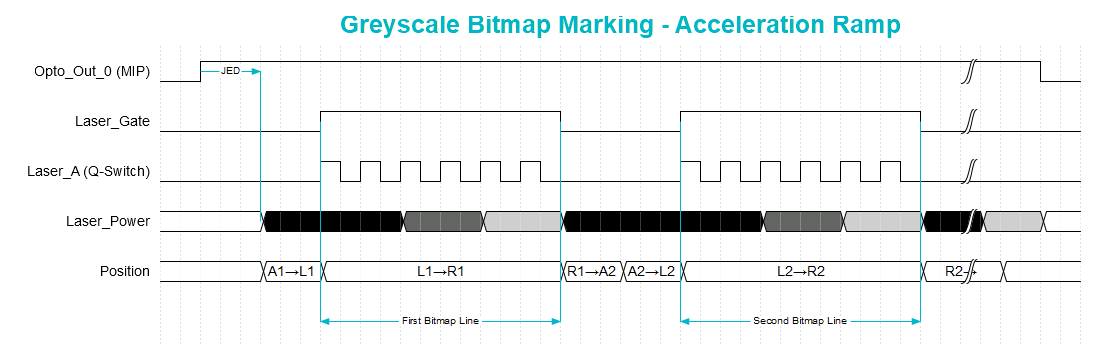
Figure 307: Timing Diagram Grayscale Bitmap
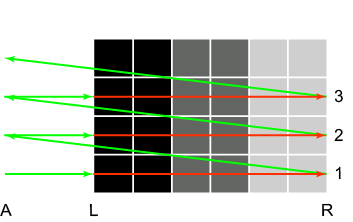
Figure 308: Test bitmap with 6 pixels per line for unidirectional operation from left (L) to right (R) including a ramp starting at A (green - jump, red - mark) |
The timing diagram above (Figure 307) shows the laser signals provided by the USC card for grayscale bitmap marking with Gray Advanced mode. This diagram should be seen as a schematic overview for the different signals and parameters which are involved in bitmap marking. The test bitmap itself consists of lines of six pixels (2 x black, 2x dark gray, 2x light gray, see Figure 308). Only the first two lines are shown in the timing diagram. Figure 308 shows the relevant positions for the scanner movement: A is the start of the acceleration, L is the left border pixel of the bitmap, R is the right border pixel of the bitmap. The numbers 1, 2 and 3 count the bitmap lines and are used together with A, R and L to connect the timing diagram and the test bitmap. Jumps between positions are displayed in green, a marking (movement of the scanner with simultaneous laser emission) is displayed in red.
The following signals are shown in the timing diagram (Figure 307): •Opto_Out_0 (MIP): The Mark in Progress signal stays high during the entire marking process. The Job Execution Delay (JED) is the time which is waited after the raising edge of the MIP before the first laser power value is set. •Laser_Gate: The Laser_Gate signal is activated at the marking start of each bitmap line and inactivated at its end. •Laser_A (Q-Switch): This signal usually triggers single laser shots with the pen frequency. •Laser_Power: Here, the power is shown in the same color as the pixel in the test bitmap. After finishing a bitmap line, the Laser_Gate is inactivated and the power of the first pixel of the next line is applied before the jump. •Position: This line in the timing diagram represents the position of the scan head. The scanner movement starts at the beginning of the acceleration ramp A1. From here, the scanner accelerates to the first pixel of the first line L1. Then, the bitmap line is marked and the scanner moves to R1 with constant speed. After finishing the bitmap line, the scanner jumps to the start position of the second line A2. This procedure is repeated until all lines are marked. The following parameters of the applied pen used to modify the bitmap marking are illustrated in the timing diagrams (Figure 307 and Figure 309): Acceleration Ramp: In the example timing diagram above (Figure 307), the acceleration ramp is active. The scanner starts at position A1 to accelerate up to the marking speed which is reached at the position of the first pixel L1. With increase of the acceleration ramp parameter, the duration of the ramping and thus the whole bitmap marking is increased. The acceleration ramp will be added for each bitmap line. Power Shift: The effect of the power shift is shown in the timing diagram below (Figure 309). With increase of the power shift parameter, the change of the power values will be set earlier in respect to the activation of Laser_Gate. This gives the laser more time to switch to the desired power level. The power shift will be added for each bitmap line. |
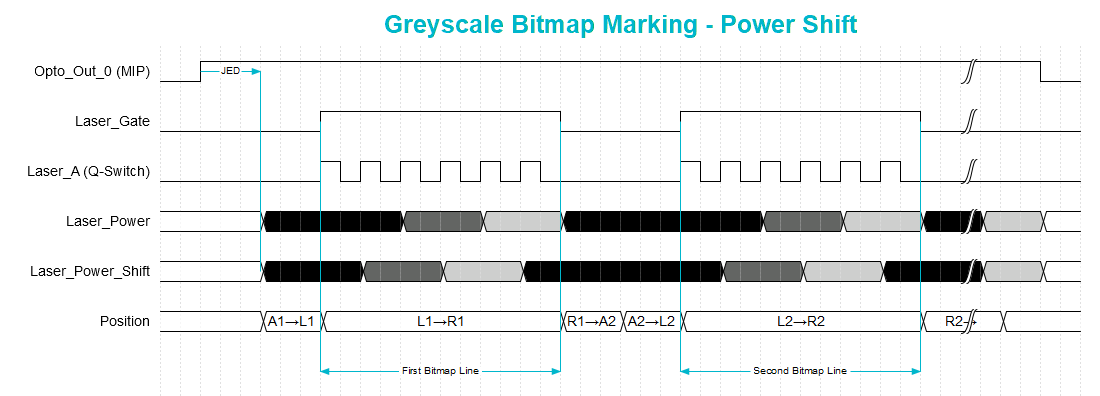
Figure 309: Timing Diagram Grayscale Bitmap - Power Shift